
Shooting Angles
Draw a line from the ball to each goalpost. The angle between those two lines shows how much of the goal a shooter can aim at. Shots from wider angles go in more often.
About a 4-minute read.

Start with one shot
How much of the goal can the shooter see?
Stand where the shot is taken and draw a line to each post. The angle between the lines is the shooting angle, measured in degrees. The bigger it is, the more of the goal there is to aim at.
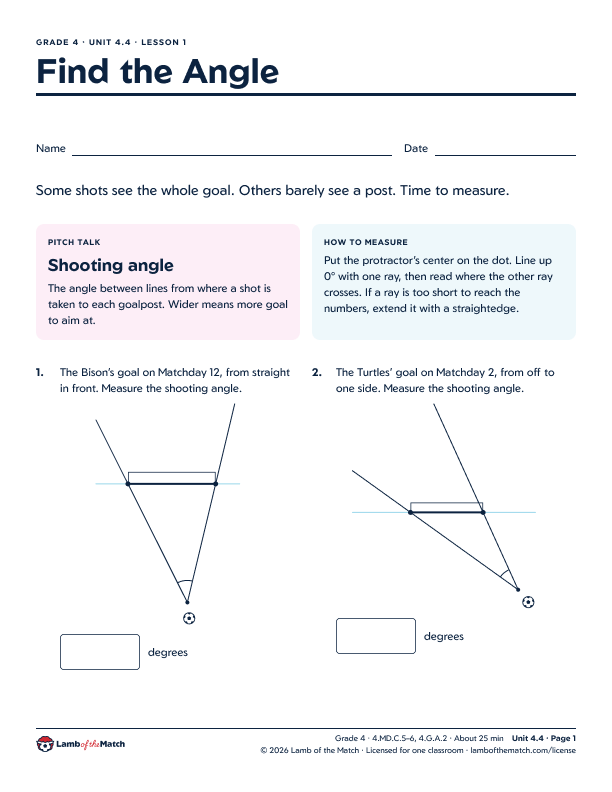
From the penalty spot, 11 meters straight out, the angle is about 37°. From a spot that’s also 11 meters from the middle of the goal, but out toward the side, it shrinks to about 23°.
2 · 9 · 21
goals per 100 shots, by shooting angle
Try it
Move the shooter and measure the angle
Drag the ball anywhere near the goal. The blue wedge is the shooting angle, from the ball to each post. Watch it open up as you move closer and toward the middle.
Drag the ball, or use the arrow keys.Drag the ball. The angle is measured from the ball to the inside of each post, at the real goal width of 7.32 meters.
Shooting angle
37°
Shots from angles over 30° went in about 21 out of 100 this season.
- Goes in
- Doesn’t go in
Why the angle changes
-
Closer opens it up
The nearer the ball is to the goal, the wider the angle. From the six-yard box, it’s about 67°.
Try it: drag the ball toward the goal.
-
Toward the middle opens it up
At the same distance, a shot from straight in front sees more of the goal than one from the side.
Try it: compare Penalty spot and Off to the side.
-
Far away shrinks it
From just outside the penalty area, about 18 meters straight out, the angle is only about 23°.
Try it: pick Outside the box.
-
Two different spots, same angle
A close shot from the side and a far shot from the middle can have the same angle.
Try it: compare Off to the side and Outside the box: both about 23°.
The goal-rate bands use every non-penalty shot in the almanac, with the angle worked out from each shot’s position. The angle ignores the goalkeeper and defenders, who can block part of the goal.
What it doesn’t tell you
A wide angle isn’t a sure goal
The angle only measures how much of the goal is open from where the ball is. It doesn’t know about the goalkeeper, the defenders, or whether the shot is a header.
The Geese took shots from the widest angles in the league, about 31° on average, but scored only about 7 goals per 100 shots. Many of their shots were headers, which go in less often. Expected goals puts the angle together with all of that.
Even shots from over 30° went in only about 1 time in 5.
How expected goals worksTwo shots were both about 10 meters from the middle of the goal. An Otters shot on Matchday 5 came from out to the side, with an angle of 24°. An Owls shot on Matchday 6 came from straight in front, with an angle of 40°. Which shooter could see more of the goal, and by how many degrees?
The Owls shooter: 40° − 24° = 16° more. Straight in front, you see more of the goal.
A whole season
Where each team shoots from
Average a team’s shooting angles over the season and you can see its style: some shoot from anywhere, some wait until they’re close and in front.
The Bees shot from the narrowest angles
The Bees took 232 shots, more than anyone, at an average angle of about 19°. They scored on about 5 of every 100.
The Foxes waited for better looks: about 30° on average, and about 14 goals per 100 shots, the best in the league.
Average shooting angle by team
Riverfield League · the whole season, penalties left outThe whole season, penalties left out
- Bees 4.7 goals per 100 shots
- Owls 10.1 goals per 100 shots
- Robins 7.9 goals per 100 shots
- Turtles 11.6 goals per 100 shots
- Otters 12.6 goals per 100 shots
- Bison 13.6 goals per 100 shots
- Foxes 13.9 goals per 100 shots
- Geese 6.9 goals per 100 shots
What could explain it? The Bees shoot from anywhere, often from far out, where the goal looks small. The Foxes’ through balls put shooters close to goal and in front of it, where the angle opens up.
An average is a total divided by a count. Add up all 232 of the Bees’ shooting angles, divide by 232, and you get about 19.4°. Averages hide variety: every team took some shots from wide angles and some from narrow ones.
Shooting angle is one ingredient of expected goals, along with distance, headers, and defenders.
In the classroom
Teach it with Angles through Shot Locations
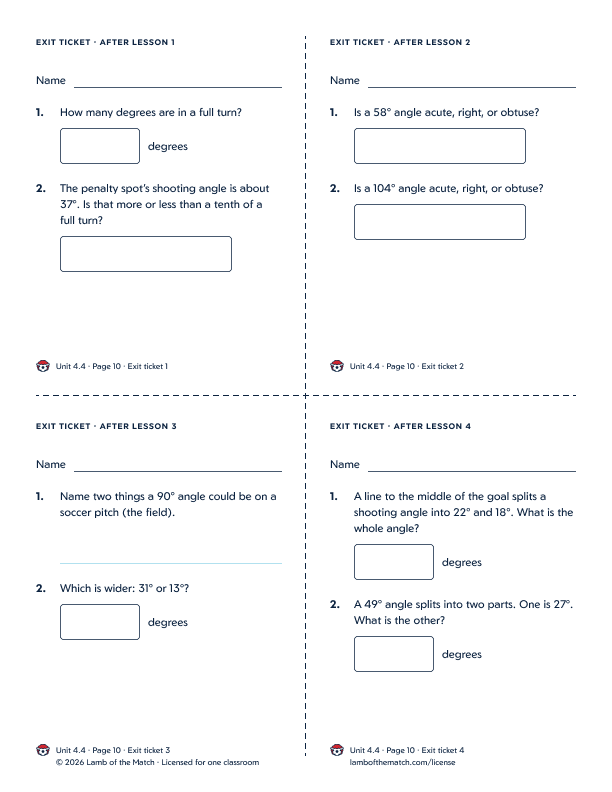
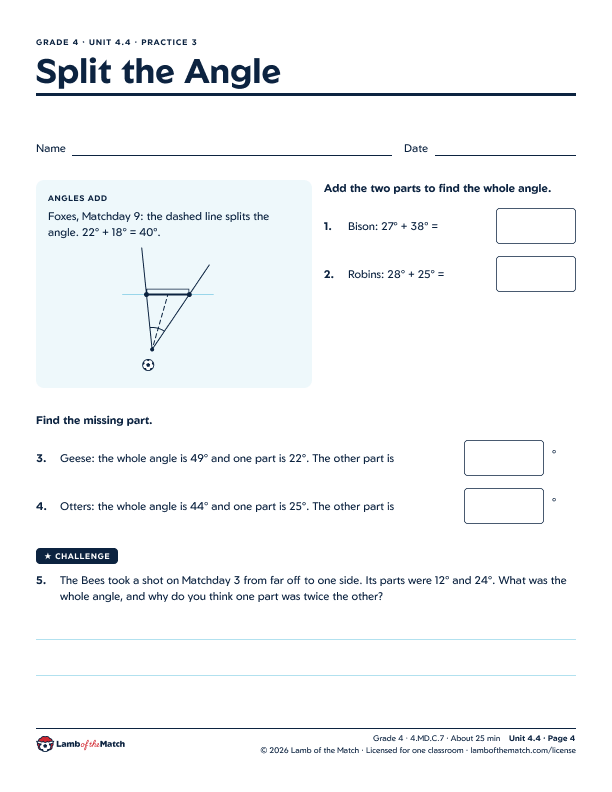
Grade 4, Unit 4.4 turns shooting angles into lessons on measuring, drawing, and adding angles, all set in the Riverfield League.
Print-at-home PDFs, licensed for one teacher’s classroom.