

Pressing
Pressing means chasing the other team to win the ball back near their goal. Analysts measure it with PPDA, short for passes per defensive action: how many passes a team lets the other team make before it tries to win the ball. A lower number means more pressing.
About a 5-minute read.

Start with one match
How many passes before they try to win it back?
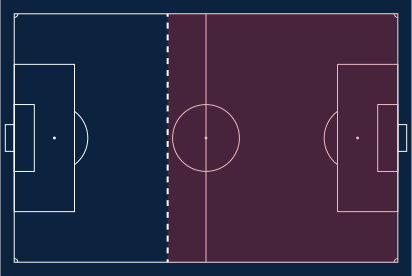
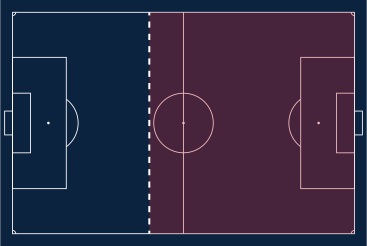
A defensive action is a tackle, an interception, a challenge, or a foul. Count them only in the 60% of the field nearest the other team’s goal, where pressing happens.
On Matchday 2 of the Riverfield League, our fictional league, the Foxes made 345 passes in that part of the field. The Robins made 53 defensive actions there. That’s 345 ÷ 53 ≈ 6.5: the Robins let the Foxes make only about 6 or 7 passes each time before trying to win the ball.
Try it
Divide the passes by the pressing
PPDA is the other team’s passes in the pressing zone divided by your defensive actions there. Change either count and watch the number slide.
Foxes passes · in the pressing zone
Robins defensive actions · in the pressing zone
Robins v Foxes is Matchday 2 (345 ÷ 53). Turtles v Otters is Matchday 10 (407 ÷ 22). Robins season is all 14 matches (4,692 ÷ 596).
Passes per defensive action
6.5
345 ÷ 53 ≈ 6.5
About 6 or 7 passes each time: that’s heavy pressing.
Why the number moves
-
More defensive actions, lower number
Every tackle, interception, challenge, or foul in the pressing zone makes the number smaller.
Try it: add 10 defensive actions.
-
More passes, higher number
If the other team strings passes together without being bothered, the number grows.
Try it: add 100 passes.
-
Lower means more pressing
It’s a “per” number: passes per defensive action. A team that presses hard lets fewer passes go by each time.
Try it: pick Turtles v Otters.
-
A rate, not a total
Because it’s a rate, a whole season and a single match can be compared on the same scale.
Try it: pick Robins season and compare it with one match.
Defensive actions here are tackles, interceptions, challenges, and fouls in the 60% of the field nearest the other team’s goal, as the almanac counts them. Analysts don’t all draw the pressing zone in the same place, so PPDA from different sources can differ.
What it doesn’t tell you
Pressing hard isn’t the same as winning
PPDA shows how a team defends, not whether it works. Pressing can win the ball near goal, but it leaves space behind if the other team gets past it.
The Robins pressed harder than anyone, about 7.9 passes per defensive action, and finished 7th. The Turtles pressed least, about 15.9, and finished 3rd.
Pressing is a style. To see whether it worked, look at results and expected goals too.
How expected goals worksOver the season, the Robins’ opponents made 4,692 passes in the pressing zone, and the Robins made 596 defensive actions there. For the Turtles, it was 5,283 passes and 332 actions. Find each team’s PPDA. Which team pressed more?
Robins: 4,692 ÷ 596 ≈ 7.9. Turtles: 5,283 ÷ 332 ≈ 15.9. Lower means more pressing, so the Robins pressed about twice as much.
A whole match
Compare both teams’ pressing
Every match has two PPDA numbers, one for each team. Put them side by side to see who pressed harder that day.
The pressing team got out-pressed
On the final day, the Robins, the hardest-pressing team in the league, played away at the Otters. The Otters made 52 defensive actions in the Robins’ end, about one for every 6 Robins passes.
The Robins’ PPDA was 9.4, well above their season’s 7.9. The Otters won 2–1 and took 16 shots to the Robins’ 7.
Otters United 2–1 Sporting Robins
Riverfield League · Matchday 14
- Otters
- Robins
- Possession
- Otters: 54% , Robins: 46%
- Defensive actions in the pressing zone
- Otters: 52 , Robins: 35
- Shots
- Otters: 16 , Robins: 7
- Expected goals
- Otters: 2.45 , Robins: 0.81
What could explain it? The Otters pressed almost as hard as the Robins all season, about 8.2 passes per defensive action, 2nd in the league. On the final day, at home, they pressed harder than the team built to press.
To compare two rates, divide one by the other: 9.4 ÷ 6.3 ≈ 1.5. The Robins let the Otters make about one and a half times as many passes per defensive action as the Otters let them make. With a lower-is-more number, the smaller value means more pressing.
PPDA describes a style, and styles shift with the opponent.